For marketing agencies sending email campaigns at volume, there are a few key metrics that matter most, when it comes to understanding deliverability. It doesn’t matter how good or targeted your campaigns are if your messages don’t even land in your client’s customer inboxes.
Because when you have poor deliverability, you’re losing money—and you’re letting your clients down.
These email deliverability benchmarks will give you some insight into how your agency stacks up with the rest of the industry. By knowing typical inbox placement rates, bounce rates, complaint rates, and spam trap hits, you can easily identify areas that have potential and areas that need to be revisited. Benchmarks also allow you to define realistic goals, uncover problems, and make the necessary improvements to achieve the highest possible results.
In this guide, you will learn about the current email deliverability benchmarks for marketing agencies. We’re also going to look at how B2B deliverability compares with B2C. Finally, we’ll provide some practical tips to help your agency outperform these benchmarks and keep a good sender reputation with all major email providers.
Key email deliverability metrics every marketing agency should keep an eye on
To improve email campaign performance, marketing agencies must monitor several core deliverability metrics. These indicators reveal how well your emails are performing in reaching inboxes and how recipients respond. Understanding each metric and its benchmarks helps agencies diagnose issues and optimize campaigns effectively.
Inbox placement rate across major providers
Inbox placement rate is the percentage of sent emails that land directly in the recipient’s inbox rather than the spam or junk folder.
Inbox Placement Rate = Emails in inbox / Emails delivered
Reminder: This does not include emails that weren’t delivered at all, such as hard bounces. So inbox placement rates are based on delivered emails, and not merely sent emails.
Benchmarks from Validity’s report:
- Global: 83.5% (trending downwards since 2024)
- Gmail: 87.2%
- Outlook: 75.6% (This makes it the toughest mailbox when it comes to deliverability)
- Yahoo: 86%
🔖 Related Reading: Mastering Global Email Deliverability in 2024–2025—a research report by the Warmy Research Team has more relevant research-based statistics on inbox placement, including benchmarks by industry and region. For example:
- Europe has the highest inbox placement rate at ~91%
- Asia-Pacific has the lowest at ~78% on average.
- North America and Latin America are in the middle (mid-to-upper-80%).
- Even within regions, there are polarizing differences at the level country. For example, in North America, Canada has a ~90% inbox placement rate vs. ~85% in the US
- APAC: Australia has a near 90% inbox placement rate (similar to top European countries), Brazil does pretty well at ~87%, but India lags behind at ~69-70%.
Bounce rate (Hard vs. Soft)
Bounce rate is the percentage of emails that fail to be delivered. Hard bounces are permanent failures (invalid email addresses), while soft bounces are temporary issues (full inbox, server downtime). A high bounce rate signals poor list quality or technical issues. So try to keep this number low.
Bounce rate = (Number of bounced emails / Number of emails sent) x 100
🔖 Related Reading: Understanding Email Bounce: The Difference Between Hard and Soft Bounces
Benchmarks:
- A good average email bounce rate for email marketing is less than 2%. Bounce rates below 1% are ideal and bounce rates that exceed 2% signals issues with list quality.
- The average benchmark differs per industry, but here are some examples relevant for marketing agencies: Business and finance (0.55%), beauty and personal care (0.33%), and construction (1.28%)
Complaint rate
Spam complaints happen when recipients deliberately mark an email as spam. This sends a strong signal to the email provider that the message is not welcome. The provider will then take note of this for future emails that come from the sender. In short, high complaint rates can negatively affect sender reputation and deliverability
Complaint rate is the percentage of recipients who mark your email as spam or report it through their email client. High complaint rates damage sender reputation quickly.
Complaint rate = (the number of spam complaints / the total emails delivered) x 100
Benchmarks:
- Gmail and Yahoo introduced new guidelines for bulk senders in 2024. The threshold for spam complaints is 0.3%.
- It’s better to aim for an average spam complaint rate below 0.1%.
🔖 Related Reading: Spam Complaint Rate: What It Is and How to Reduce It
Additional email marketing benchmarks marketing agencies must keep an eye on
Beyond core deliverability statistics, there are other email marketing metrics that provide valuable insights into campaign effectiveness and audience engagement. Tracking these stats helps agencies optimize messaging, measure ROI, and maintain healthy lists.
Open rates
The percentage of recipients who open your email out of the total delivered. A high open rate indicates how effective and interesting your subject line is.
Open rate = (Number of emails opened / Number of recipients) x 100%
Benchmark:
- Average email open rate: 19.21%
- Aim for an open rate of 20% to 40%
- Marketing and advertising average open rate is 19.30%.
🔖 Related Reading: 14 Tips For Writing An Excellent Email Subject Line + Examples
Click-through rates (CTR)
CTR is the percentage of recipients who click on one or more links in your email. This metric matters as it measures how your contacts engage with your emails.
Click-through rate = (Number of people who clicked on a link in the email / Number of emails delivered) x 100
Benchmark:
- Average CTR is 2.62% though it still differs per industry. For example, eCommerce CTR drops to 1.74% while CTR for the education and training industry is 3.02%.
- The marketing industry is a bit on the low end of average CTR at 2.6%
🔖 Related Reading: Boost Your Email Click-Through Rate and Skyrocket Engagement
Revenue Per Recipient (RPR)
For marketing agencies, it’s all about helping your clients grow (more revenue, more profit). So, it’s important to follow how much they are able to extract from email marketing. Average revenue generated per email recipient directly ties email performance to business outcomes.
RPR = total revenue generated / total number of message sent
Benchmark:
- Varies widely by industry, but a positive RPR indicates campaign profitability.
- For all ecommerce, the average is $0.10.
Unsubscribe rate
The percentage of recipients who opt out from receiving future emails. We hear you—no marketer likes seeing unsubscribe rates increase. Which is precisely why you need no track this. Rising unsubscribes mean you’re not delivering value to your email list.
Benchmark:
- Average unsubscribe rates: 0.2% – 0.5%. Anything under 0.2% is considered excellent.
- Average unsubscribe rate for marketing is 0.01%, and for ecommerce it is 0.13%.
- Rates above 0.5% require review of content or sending practices.
The difference between B2B vs. B2C deliverability benchmarks
Deliverability benchmarks can vary significantly between B2B and B2C email campaigns due to differences in audience behavior, email content, and filtering mechanisms. Marketing agencies should adjust their performance expectations based on the nature of the audience. B2B campaigns may target higher inbox placement and engagement rates but should maintain vigilance around corporate spam filters. On the other hand, B2C campaigns require stricter list hygiene and aggressive segmentation to improve deliverability metrics.
Engagement and filtering
- B2B emails tend to generate higher engagement due to targeted, professional content. Additionally, Outlook and corporate email providers dominate. They have stricter spam filters but rely heavily on user interaction signals.
- B2C emails are sent to larger, more diverse audiences with varying levels of interest and different stages in customer journey. Engagement tends to be lower, requiring more emphasis on segmentation and personalization.
Variations in bounce and complaint rates
- B2B lists usually have lower bounce rates since contacts are managed more often. Spam complaints tend to be fewer since B2B recipients generally complain less, but B2C campaigns may see higher complaint rates due to recipients getting overwhelmed by marketing emails.
- B2C lists can have higher bounce rates due to outdated or even purchased lists.
Common deliverability pitfalls for agencies and how to avoid them
Marketing agencies face unique challenges that can impact email deliverability across multiple clients and campaigns. Recognizing and addressing common pitfalls is essential to maintain a strong sender reputation and consistent inbox placement.
List hygiene challenges
Maintaining clean, verified email lists is difficult when handling multiple clients or large volumes. Outdated or invalid addresses increase bounce rates and damage reputation.
How to Avoid:
- Regularly verify and remove invalid emails with reliable tools.
- Segment lists by engagement to focus on active recipients.
🔖 Related Reading: 6 Must-Have Email List Scrubbing Tools for Spotless List Hygiene in 2025
Inconsistent authentication setup
Failing to uniformly implement SPF, DKIM, and DMARC across all client domains leads to failed authentication and spam filtering.
How to avoid:
- Standardize authentication protocols for every domain you manage.
- Use automation tools to monitor DNS records and compliance.
- Educate clients about the importance of proper setup.
Q: What are SPF, DKIM, and DMARC?
A: SPF (Sender Policy Framework) determines which mail servers are permitted to send emails on behalf of your domain. DKIM (DomainKeys Identified Mail) is another layer of digital signature of the email, to prove that it has not been tampered with and is legitimately from your domain. DMARC (Domain-based Message Authentication, Reporting & Conformance) builds on SPF and DKIM by instructing email providers on how to handle unauthenticated emails and by offering reports on how well they are performing.
Related Reading: SPF, DKIM, and DMARC: Boosting Email Security and Deliverability
Poor engagement management
Ignoring recipient behavior, such as unengaged contacts or high complaint rates, causes inbox providers to flag emails as spam.
How to avoid:
- Track engagement metrics closely and suppress inactive users.
- Personalize content to increase relevance and interaction.
- Use re-engagement campaigns to win back disengaged contacts.
How to use Warmy to exceed email deliverability benchmarks
Warmy.io offers marketing agencies powerful tools to surpass standard email deliverability benchmarks. By enhancing security, streamlining warm-up, and optimizing content, Warmy helps agencies achieve higher inbox placement and better campaign results.
Enhance authentication and security
Warmy assists in setting up and monitoring SPF and DMARC records correctly across all client domains.
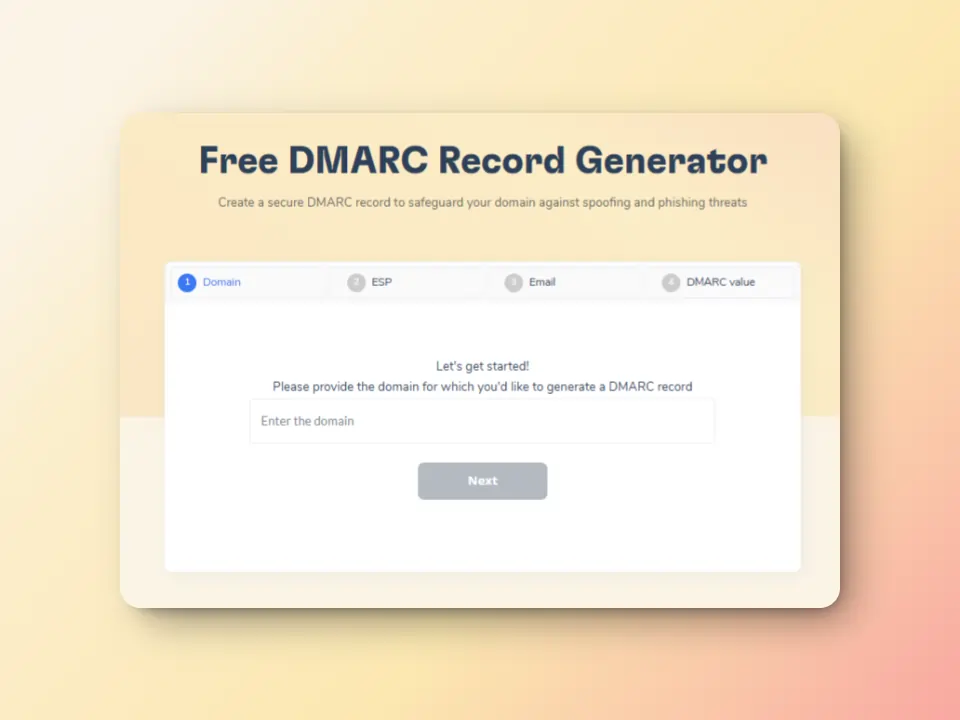
The free SPF Record Generator creates a valid SPF record to prevent unauthorized email sending. The DMARC Record Generator strengthens email security by preventing phishing and spoofing attacks.

Execute and optimizing warm-up process
To further improve the deliverability metrics of your marketing agency, you can leverage Warmy to automate the gradual warm-up of new domains and IPs tailored to your agency’s sending patterns. Of course, warming up takes time—and it can vary depending on a number of factors. (Read more: How Long Does It Take to Warm Up an Email Domain for Marketing Agencies)
Warmy.io’s AI-powered email warm-up simulates human-like interactions to ensure emails are opened, replied to, and marked as important. Automated archiving keeps inboxes clean while maintaining warm-up interactions.
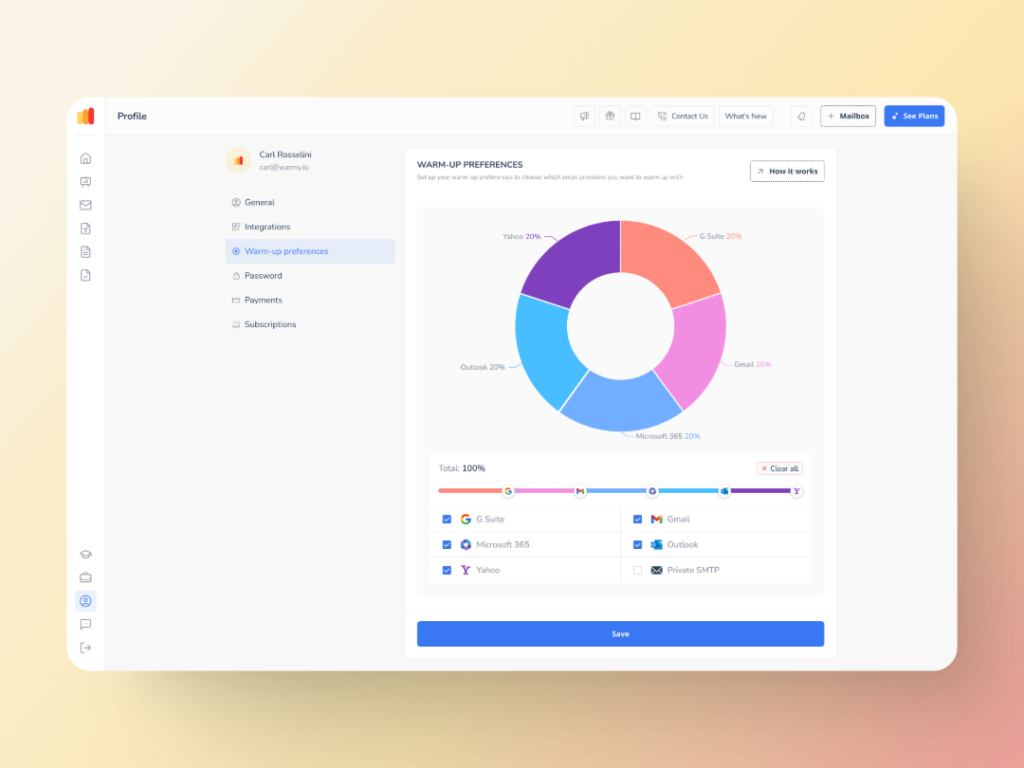
The Warmup Preferences feature can also tailor the distribution across different providers, helping senders build their reputation for specific providers.

Avoid spam filters with the Template Checker
Use Warmy’s Template Checker to scan your emails for spam triggers and formatting errors before campaigns launch. This tool helps refine subject lines, content, and HTML structure to maximize inbox placement. Now with its own Chrome Extension, you can further reduce the risk of getting caught in spam filters due to poor template design.

Higher quality warmup with advanced seed lists
Warmy provides real, active seed lists (across Gmail, Yahoo, and Outlook) to simulate authentic engagement and test inbox placement during the warm-up process. Sending to diverse seed addresses ensures your emails are evaluated across multiple providers and clients. By the time you’re ready to launch large-scale email marketing campaigns for your clients, your deliverability is already solid.

Take control of your marketing agency’s deliverability today
Don’t leave your marketing agency’s and your clients’ email performance to chance. Start tracking your deliverability metrics and use data-driven strategies to exceed industry benchmarks. With Warmy.io’s advanced tools, you can automate warm-up processes, improve authentication, and monitor your campaigns with confidence.
Start optimizing your email deliverability now with Warmy.io and deliver better results for your clients. Book your demo today.


